
How to Look Up Denver County Jail Population Data
The main hub is the Denver Sheriff Data, Policies, Reports page. It lists the interactive population reports, the latest annual reports, and the PREA audit files in one spot. 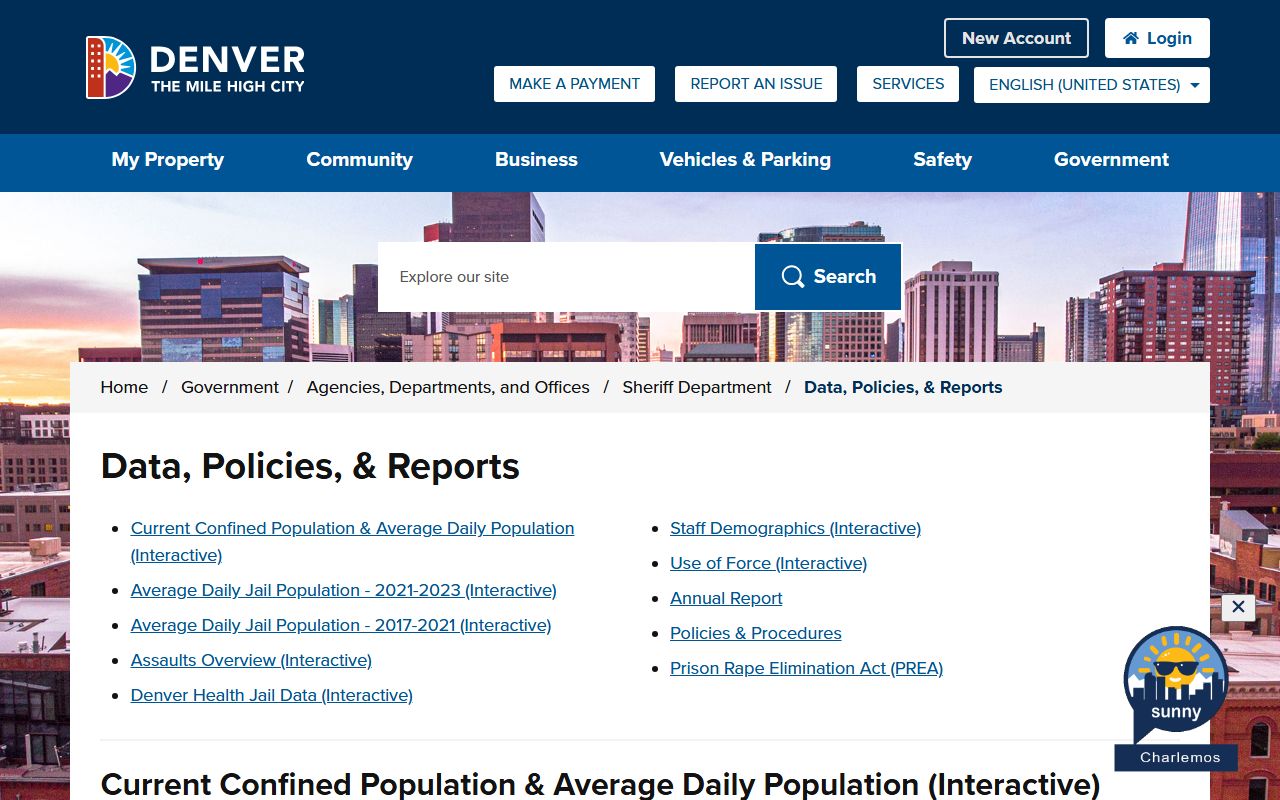 From there, the "Current Confined Population & Average Daily Population" interactive report shows averages of current daily populations inside Denver jail facilities. Two more interactive reports cover historical ADP for 2021-2023 and 2017-2021.
The dashboard refresh cadence is not stamped on the public page, so treat the figures as point-in-time. For static, citable numbers the 2025 reader-accessible Annual Report is the cleanest source. It lists bookings, length of stay, gender and race counts, custody classification, and mental health alerts. The annual report is the version used for most of the figures shown on this page. The 2024 annual report covers the prior year and is useful for year-over-year reads.
Denver County Jail Capacity Overview
Denver runs two adult jail sites: the Denver County Jail on East Smith Road and the Downtown Detention Center, also known as the Van Cise-Simonet Detention Center, at 490 W. Colfax Ave. Both fall under the Denver Sheriff Department. Rated bed counts for the full facilities are not posted on the current Sheriff pages, so the table below lists what is published and flags the gap. Two specialty pods do have stated caps: the HUMV veteran pod and the second male MAT unit.
| Facility or Unit | Stated Capacity | Notes |
|---|---|---|
| Denver County Jail (COJL) | Not posted | In-person and video visit site; 10500 E. Smith Rd. |
| Downtown Detention Center / Van Cise-Simonet (DDC) | Not posted | Downtown intake; video visits only; houses HUMV and MAT units. |
| HUMV veteran pod | Up to 64 men | Launched 2025 at Van Cise-Simonet for veterans in custody. |
| Second male MAT unit | Up to 64 people | Opened 2024 at DDC for medication-assisted treatment. |
The HUMV pod works with Veterans Court, the VA Eastern Colorado Health Care System, and community partners. The second male MAT unit grew out of a $1.65 million federal Byrne grant awarded in 2023 to expand medication for opioid use disorder. Both pods sit inside DDC and count against its overall jail bed pool.
Average Daily Population
The Sheriff's "Current Confined Population & Average Daily Population" interactive report carries the live ADP figure. The dashboard is the place to pull the most recent monthly average and to scroll back through prior months. The 2021-2023 and 2017-2021 historical reports cover the trend years in between. Specific ADP values are not pulled into the reader-accessible annual report as static text, so the interactive view is the only published source. As a static fix, the 2025 annual report's bookings (23,558), average length of stay (18 days), and average daily releases (65) give a rough read on flow through the system.
Note. The dashboard does not publish a refresh stamp. Read the on-screen filter dates before you cite a number.
Demographic Breakdown
The figures below come from the 2025 annual report and cover people booked into Denver Sheriff custody during the year. Gender counts add up to 100% with a rounding margin; race counts are reported as raw totals. Average age across all bookings was 39 years.
| Group | Count or Value | Share |
|---|---|---|
| Total bookings | 23,558 | 100% |
| Average age | 39 years | - |
| Average length of stay | 18 days | - |
| Average releases per day | 65 | - |
| Male | 18,185 | 77% |
| Female | 5,340 | 22% |
| Unknown gender | 32 | 0.8% |
| Non-Binary | 1 | 0.2% |
| White | 16,447 | - |
| Black | 6,311 | - |
| Asian or Pacific Islander | 317 | - |
| American Indian or Alaska Native | 190 | - |
| Unknown race | 293 | - |
The 2025 reader-accessible annual report carries the same figures alongside narrative on programs, accreditation, and reentry. 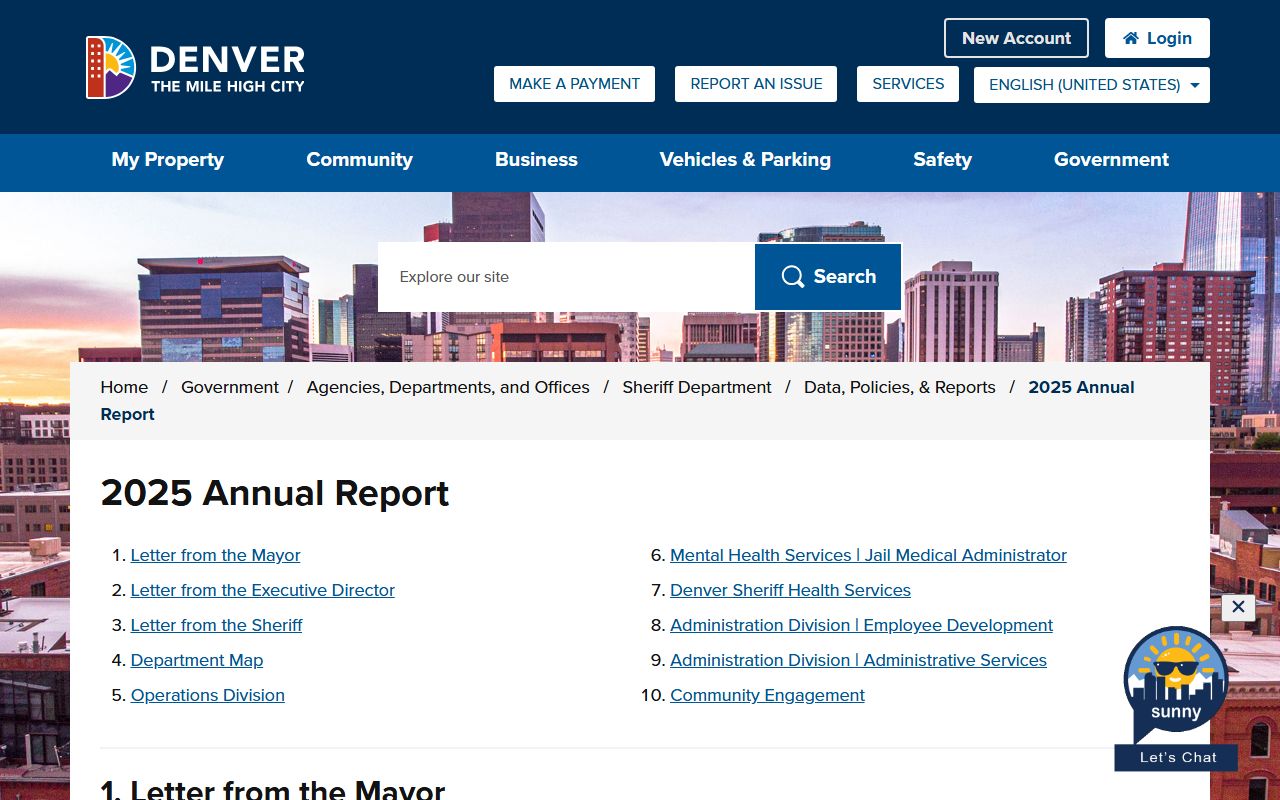 Race and gender counts are pulled from booking records, so they reflect entries into custody rather than a single-day snapshot.
Pretrial vs Sentenced Population
The 2025 annual report does not break the count into a clean pretrial-versus-sentenced split. For that view, the Vera Incarceration Trends Denver County page is the standard source. Vera last updated the Denver County profile on Feb 9, 2026 and tracks jail population, sentenced share, pretrial share, capacity, women's incarceration, held-for-other-authorities, and the local jail rate versus the state prison rate. Treat the Vera page as the go-to county-level comparison until Denver Sheriff posts a static split.
| Status | Source | Notes |
|---|---|---|
| Pretrial | Vera Incarceration Trends, Denver County | Exact share not pulled in current research pass. |
| Sentenced | Vera Incarceration Trends, Denver County | Exact share not pulled in current research pass. |
| Held for other authorities | Vera Incarceration Trends, Denver County | Includes federal and out-of-county holds. |
Vera also flags racial disparity ratios for the jail population. Compare those with the race counts above to get a sense of who is held at what rate.
Misdemeanor vs Felony Population
Denver Sheriff does not publish a misdemeanor-versus-felony cut in the 2025 annual report. The closest in-custody view is the custody classification level used to assign housing and supervision. Levels run from 1 (high) to 5 (minimum). The "Unclassified" bucket holds people who were processed through intake but released or transported before they were given a level. That bucket is the single largest group, which fits the short average length of stay.
| Classification Level | Bookings |
|---|---|
| Level 1 High | 3 |
| Level 2 Closed Custody | 233 |
| Level 3 Medium High | 2,743 |
| Level 4 Medium Low | 9,014 |
| Level 5 Minimum | 88 |
| Unclassified | 11,604 |
For an exact felony share, court filings are a better source than jail data. The state court system tracks case-level charge classes, and most felony cases route through district court while misdemeanors go to county court.
Mental Health and Medical Population
The 2025 annual report tracks three in-custody flags: competency enhancements, mental health alerts, and suicide alerts. It also reports activity from the Crisis Response Team, which works with people in crisis inside both facilities.
| Flag | None | Flagged |
|---|---|---|
| Competency Enhancements | 23,194 (99%) | 354 (1%) |
| Mental Health Alerts | 22,411 (95%) | 1,147 MH Code (5%) |
| Suicide Alerts | 23,330 (99%) | 228 Suicide Alert (1%) |
The Crisis Response Team handled 3,034 crisis incidents in 2025, an average of 11 per day. That is down from 2024, when the team encountered about 4,933 people in custody involved in a crisis, an average of 17 per day. The drop tracks with the MAT expansion at DDC and the broader Jail-to-Community program, which the 2024 annual report says grew patient counts on MAT medication by 51% and people in the J2C program by 44% from 2023 to 2024.
National and State Context
For state and national rates, the two standard sources are the Bureau of Justice Statistics at the U.S. Department of Justice and the Vera Institute Incarceration Trends portal. BJS publishes the annual "Jail Inmates" and "Census of Jails" series and reports the national jail population rate per 100,000 residents. Vera pulls the same source data and breaks it out to the county level so Denver can be set next to Colorado as a whole. 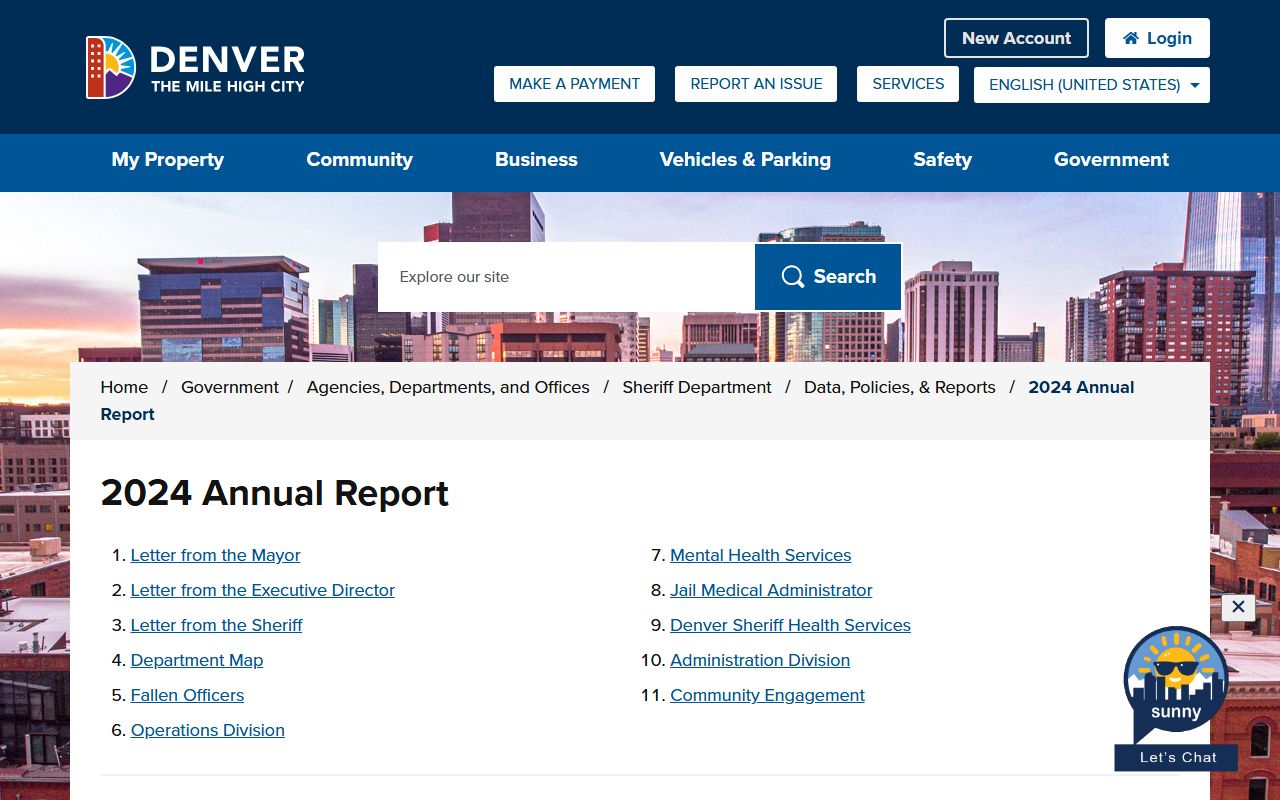 The 2024 Denver Sheriff annual report covers the local programs that shape the local rate.
| Level | Jail Population Rate per 100k | Source |
|---|---|---|
| Denver County | See Vera county profile | Vera Incarceration Trends, county-specific |
| Colorado | See Vera state profile | Vera and BJS state series |
| National | See BJS Jail Inmates report | BJS national series |
Exact rate values for the comparison are not pulled as static text in the current research pass. Treat the Vera county profile as the county-specific number and the BJS Jail Inmates series as the state and national reference. The split keeps it clear which figure is local and which is broader context.
Population Trends Over Time
Long-run trend data lives on the interactive dashboards. The 2017-2021 interactive ADP report covers the pandemic-era drop and recovery, while the 2021-2023 report covers the rebuild years. Both sit on the Sheriff Data, Policies & Reports page next to the current confined population report. For 2024 and 2025, the trend is best read through the annual reports.
- 2025 bookings: 23,558, with an 18-day average length of stay.
- 2024-2025: MAT expansion plus a second male MAT unit at DDC.
- 2024-2025 crisis incidents: 4,933 down to 3,034.
- 2025: HUMV veteran pod launched at Van Cise-Simonet, up to 64 men.
- 2021-2023: historical ADP report covers post-pandemic rebuild.
- 2017-2021: historical ADP report covers pre and pandemic-era counts.
Exact numeric ADP values for the five-year span were not pulled as static text in the current research pass. For citation work, pull the dashboard view live and save a snapshot.
Searching for Denver County Inmate Records by Name
This page covers aggregate jail population data, not name-based lookups of people in custody. For a live roster search that takes last name, first name, booking number, or CD number, use the Denver County inmate records page. Once a person is out of custody, the released inmates page is the right starting point.
Where the Data Comes From
Most of the numbers on this page come from the Denver Sheriff Department's 2025 reader-accessible annual report and the 2024 annual report. The Sheriff Data, Policies & Reports page is the main hub for those documents and for the interactive ADP and current confined population dashboards. National and state context comes from the Bureau of Justice Statistics Jail Inmates series and from the Vera Institute Incarceration Trends profile for Denver County, last updated Feb 9, 2026.
Note. Research gaps in this pass: exact rated bed counts for Denver County Jail and Downtown Detention Center, exact ADP values from the 2017-2021 and 2021-2023 interactive dashboards, and the exact pretrial-versus-sentenced split. Use the Vera county profile and the Sheriff dashboards to fill those gaps live.